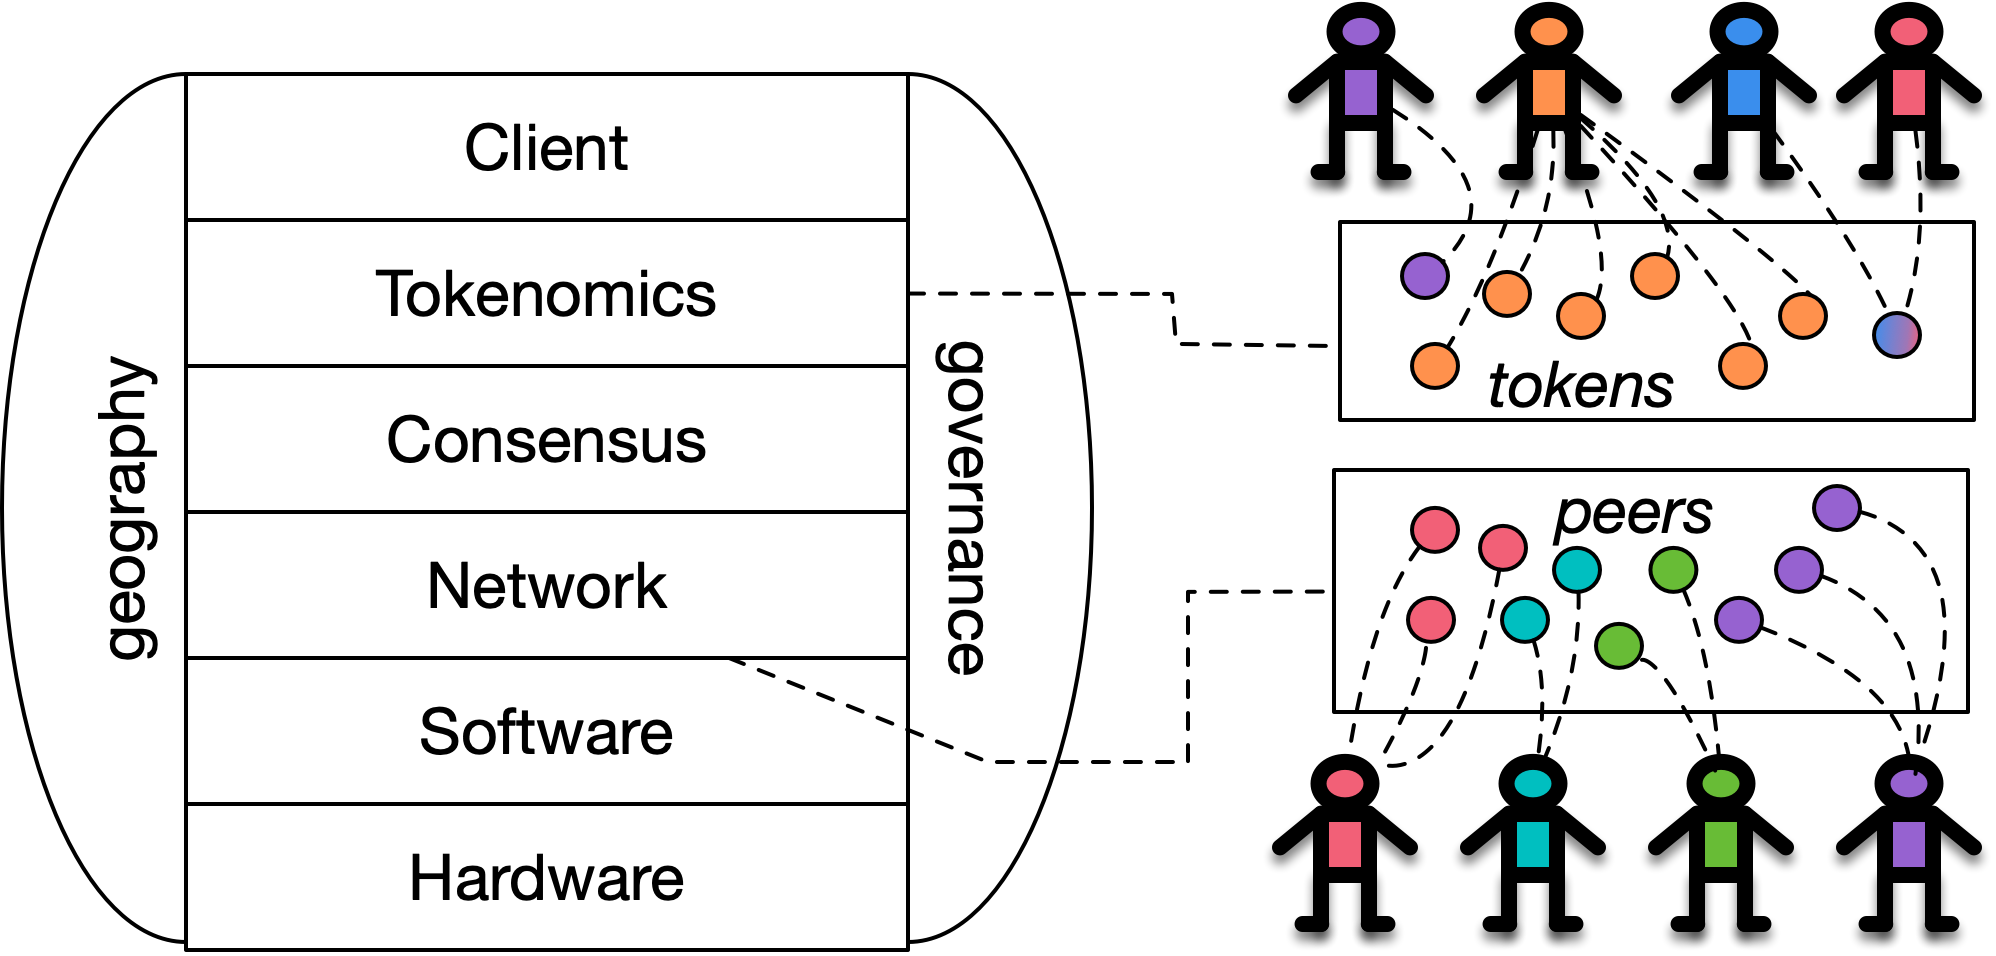
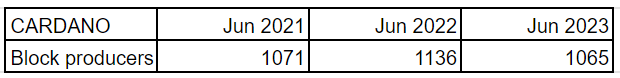
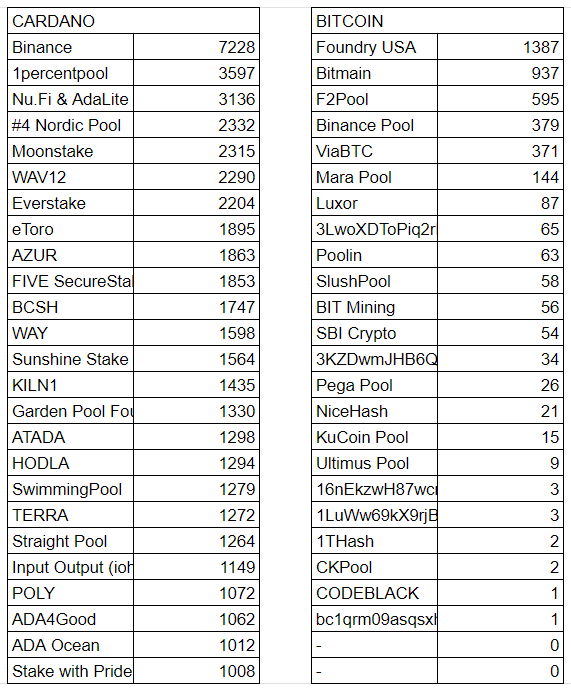
The Edinburgh Decentralization Index (EDI) project is aimed at measuring the quality of decentralization of blockchain networks in a systematic way. The team announced the release of a tool that can measure the quality of block production decentralization for several blockchain projects. We collected data for Cardano and Bitcoin. Areas of Decentralization The EDI team has defined 8 areas for which it plans to measure decentralization. These areas include hardware, software, network, consensus, tokenomics, API clients, governance, and geography. In the figure below you can see that Geography and Governance have a special position as they relate to all the remaining 6 areas. Measuring decentralization is a complex task and the team will iteratively introduce new methodologies for measuring individual areas. The team presented a tool for measuring the decentralization of various blockchain networks. Specifically, it focused on block production. There is a freely available CLI tool on GitHub that can collect data and assign blocks to the individual entities that produced them. From the data, it is possible to observe how many blocks were produced by individual block producers in a given time period (monthly by default). Several metrics can be applied to the collected data from which final results can be obtained (CSV file and graphs). The tool can be used for the following blockchains: Bitcoin, Bitcoin Cash, Ethereum, Cardano, Dogecoin, Litecoin, Tezos, ZCash. What can be found out about Bitcoin and Cardano? We used a tool for Cardano and Bitcoin to see how many independent entities are producing blocks per month. Let's use June as our reference month. In the case of Cardano, we only look at the table for the last 3 years, as the PoS consensus allowing public participation in block production was made possible by the Shelley hard fork. As you can see, blocks are produced by more than 1000 entities. Multi-pool operators are listed on one line in the table with data. For Bitcoin, we look at the data for the last 6 years. We can see that block producers did fall below 20 just once in 2022 and exceeded 30 only once in 2019. Let's take a look at the top 25 block producers for Cardano and Bitcoin. The results are for June 2023. 136,076 blocks were minted in the Cardano network during this period. 4313 blocks in the Bitcoin network. In the case of Bitcoin, we see all mined blocks in a table, as there are less than 25 pools. In the case of Cardano, 24 pools minted more than 1000 blocks. 279 pools minted more than 100 blocks per month. 785 pools mint less than 100 blocks per month. 80 pools mint 1 block per month (which is 1 block per 6 epochs). The 50 largest pools mint more than 50% of the blocks per month. For Bitcoin, the 2 largest pools mine more than 50% of the blocks per month (MAV is 2). Only 6 pools will mine more than 100 blocks. In the case of Bitcoin, the largest pool is 3.7 times larger than the fifth pool. For Cardano, this ratio is 3.1. In the case of Bitcoin, the largest pool is 23.9 times larger than the tenth pool. For Cardano, this ratio is 3.9. In both cases, the largest pool has a relatively strong position against the other pools. Bitcoin has a small number of block producers (pools) and the first 5 pools have a significant power position over the others. Cardano has a huge number of block producers, but the first 24 pools dominate (in terms of the number of blocks minted). Conclusion Block production is only one input for measuring decentralization, but it is very likely to be one of the more important inputs. Block production is dependent on holding an expensive resource. We expect to see an extension that provides resource delegation data in the near future. Download the tool and try to see for yourself the decentralization of your favorite blockchain.